

The Ups and Downs of Water
By Roger Donegan
As Hinesburg now prepares to bring a new well online, Lake Champlain water levels are clawing back from a near record low.
Last month, Hinesburg passed a $2.1 million bond to connect a new well to its water system. At the same time, Champlain Water District’s second two-million gallon above-ground storage tank on Dorset Street will be filled with additional water from Lake Champlain to distribute. Water, water everywhere.
Actually we’ve been on a bit of a rollercoaster in recent years with regards to local ground water and Lake Champlain water levels: flooding bookended by drought. The town’s water supply will finally have some backup. And Lake Champlain’s water level is beginning to claw its way up: this fall it was at a near record low.
The United States Geological Survey (USGS) array of fixed stream monitoring sites in the Lake Champlain watershed have tracked and recorded regional water level data for more than a century. The USGS website is designed to provide “real-time” compiled data, though it currently cautions visitors to its websites that data might not yet be up-to-date following the government shutdown.
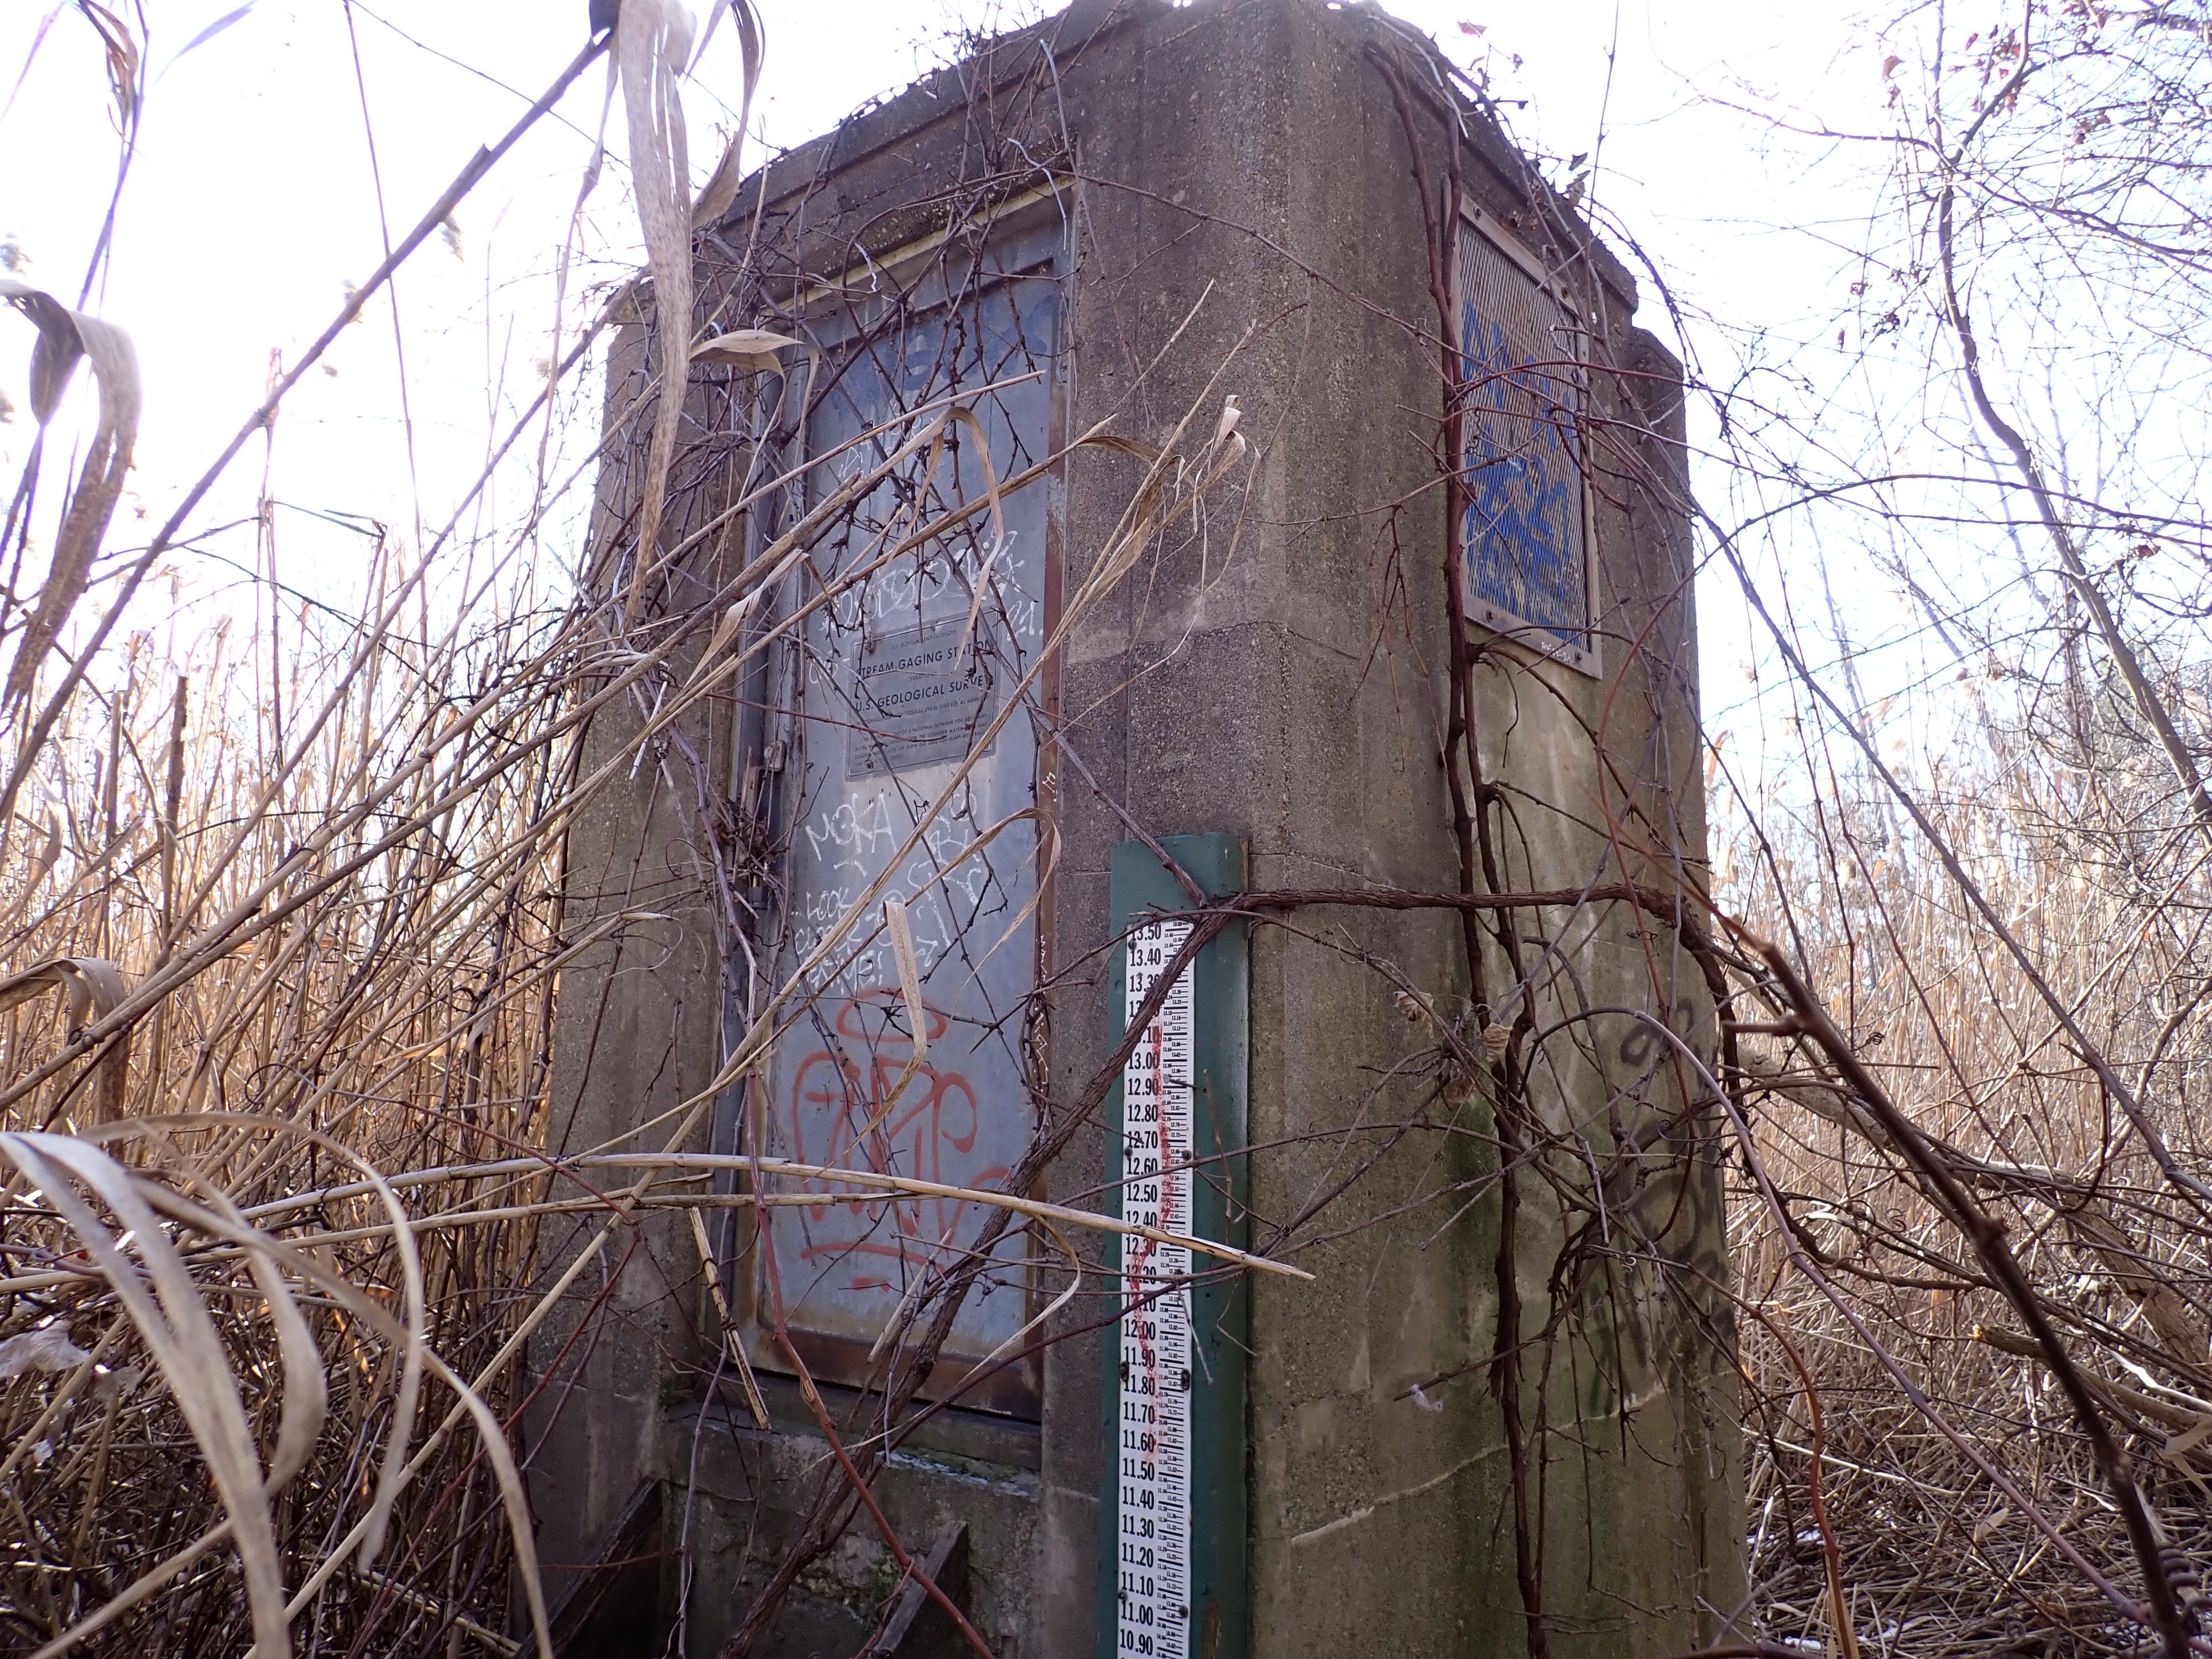
As Lake Champlain’s water level inched ever closer to the 1908 record low of 92.4 feet above sea level this fall, I tested the pushbutton on the outdoor ECHO Science Center USGS Lake Monitoring Station. This instrument suite installed in 2004 includes an LED display readout of three parameters: temperature, conductivity, and lake level. The pathway for data, however, is more complicated: from instruments to transmitter to satellite, back to USGS offices then onto the internet. I found the instantaneous LED readout for lake level to be several inches different from the lake level given online.
If you bushwhacked through a wild stretch of Burlington’s former North Forty, you just might find the old concrete stream gauging station, which housed the first continuous automatic recorder of lake level that began in September 1939. Close up, the old concrete station stands shockingly isolated and seemingly as abandoned as an old guard shack on the moon. The well hole bored down through the saturated soils under the gauging station made for continuous measurements of lake level free of interference from waves, wind and winter ice.
The spiffy ECHO Science Center was built within the footprint of the former Naval Reserve Center which closed in 2001 and was often referred to as “The Blue Box” in the media. The impenetrable bulkhead steel barrier and waterside promenade on the immediate west and south sides of the Science Center trace the rectangular sides of the indented boat slip to Hoehl Park, named for the benefactors.
The outdoor USGS gauging station installed in 2004 occupies a corner of the promenade mounted on the waist high bulkhead. In years of mean average lake levels, the unobstructed view of the lake from the bulkhead is just like a view from a boat – plenty of water in all directions. This year, with disturbingly low lake levels and some of the lake’s rocky bottom poking up through, the view resembled that of a boat run aground.
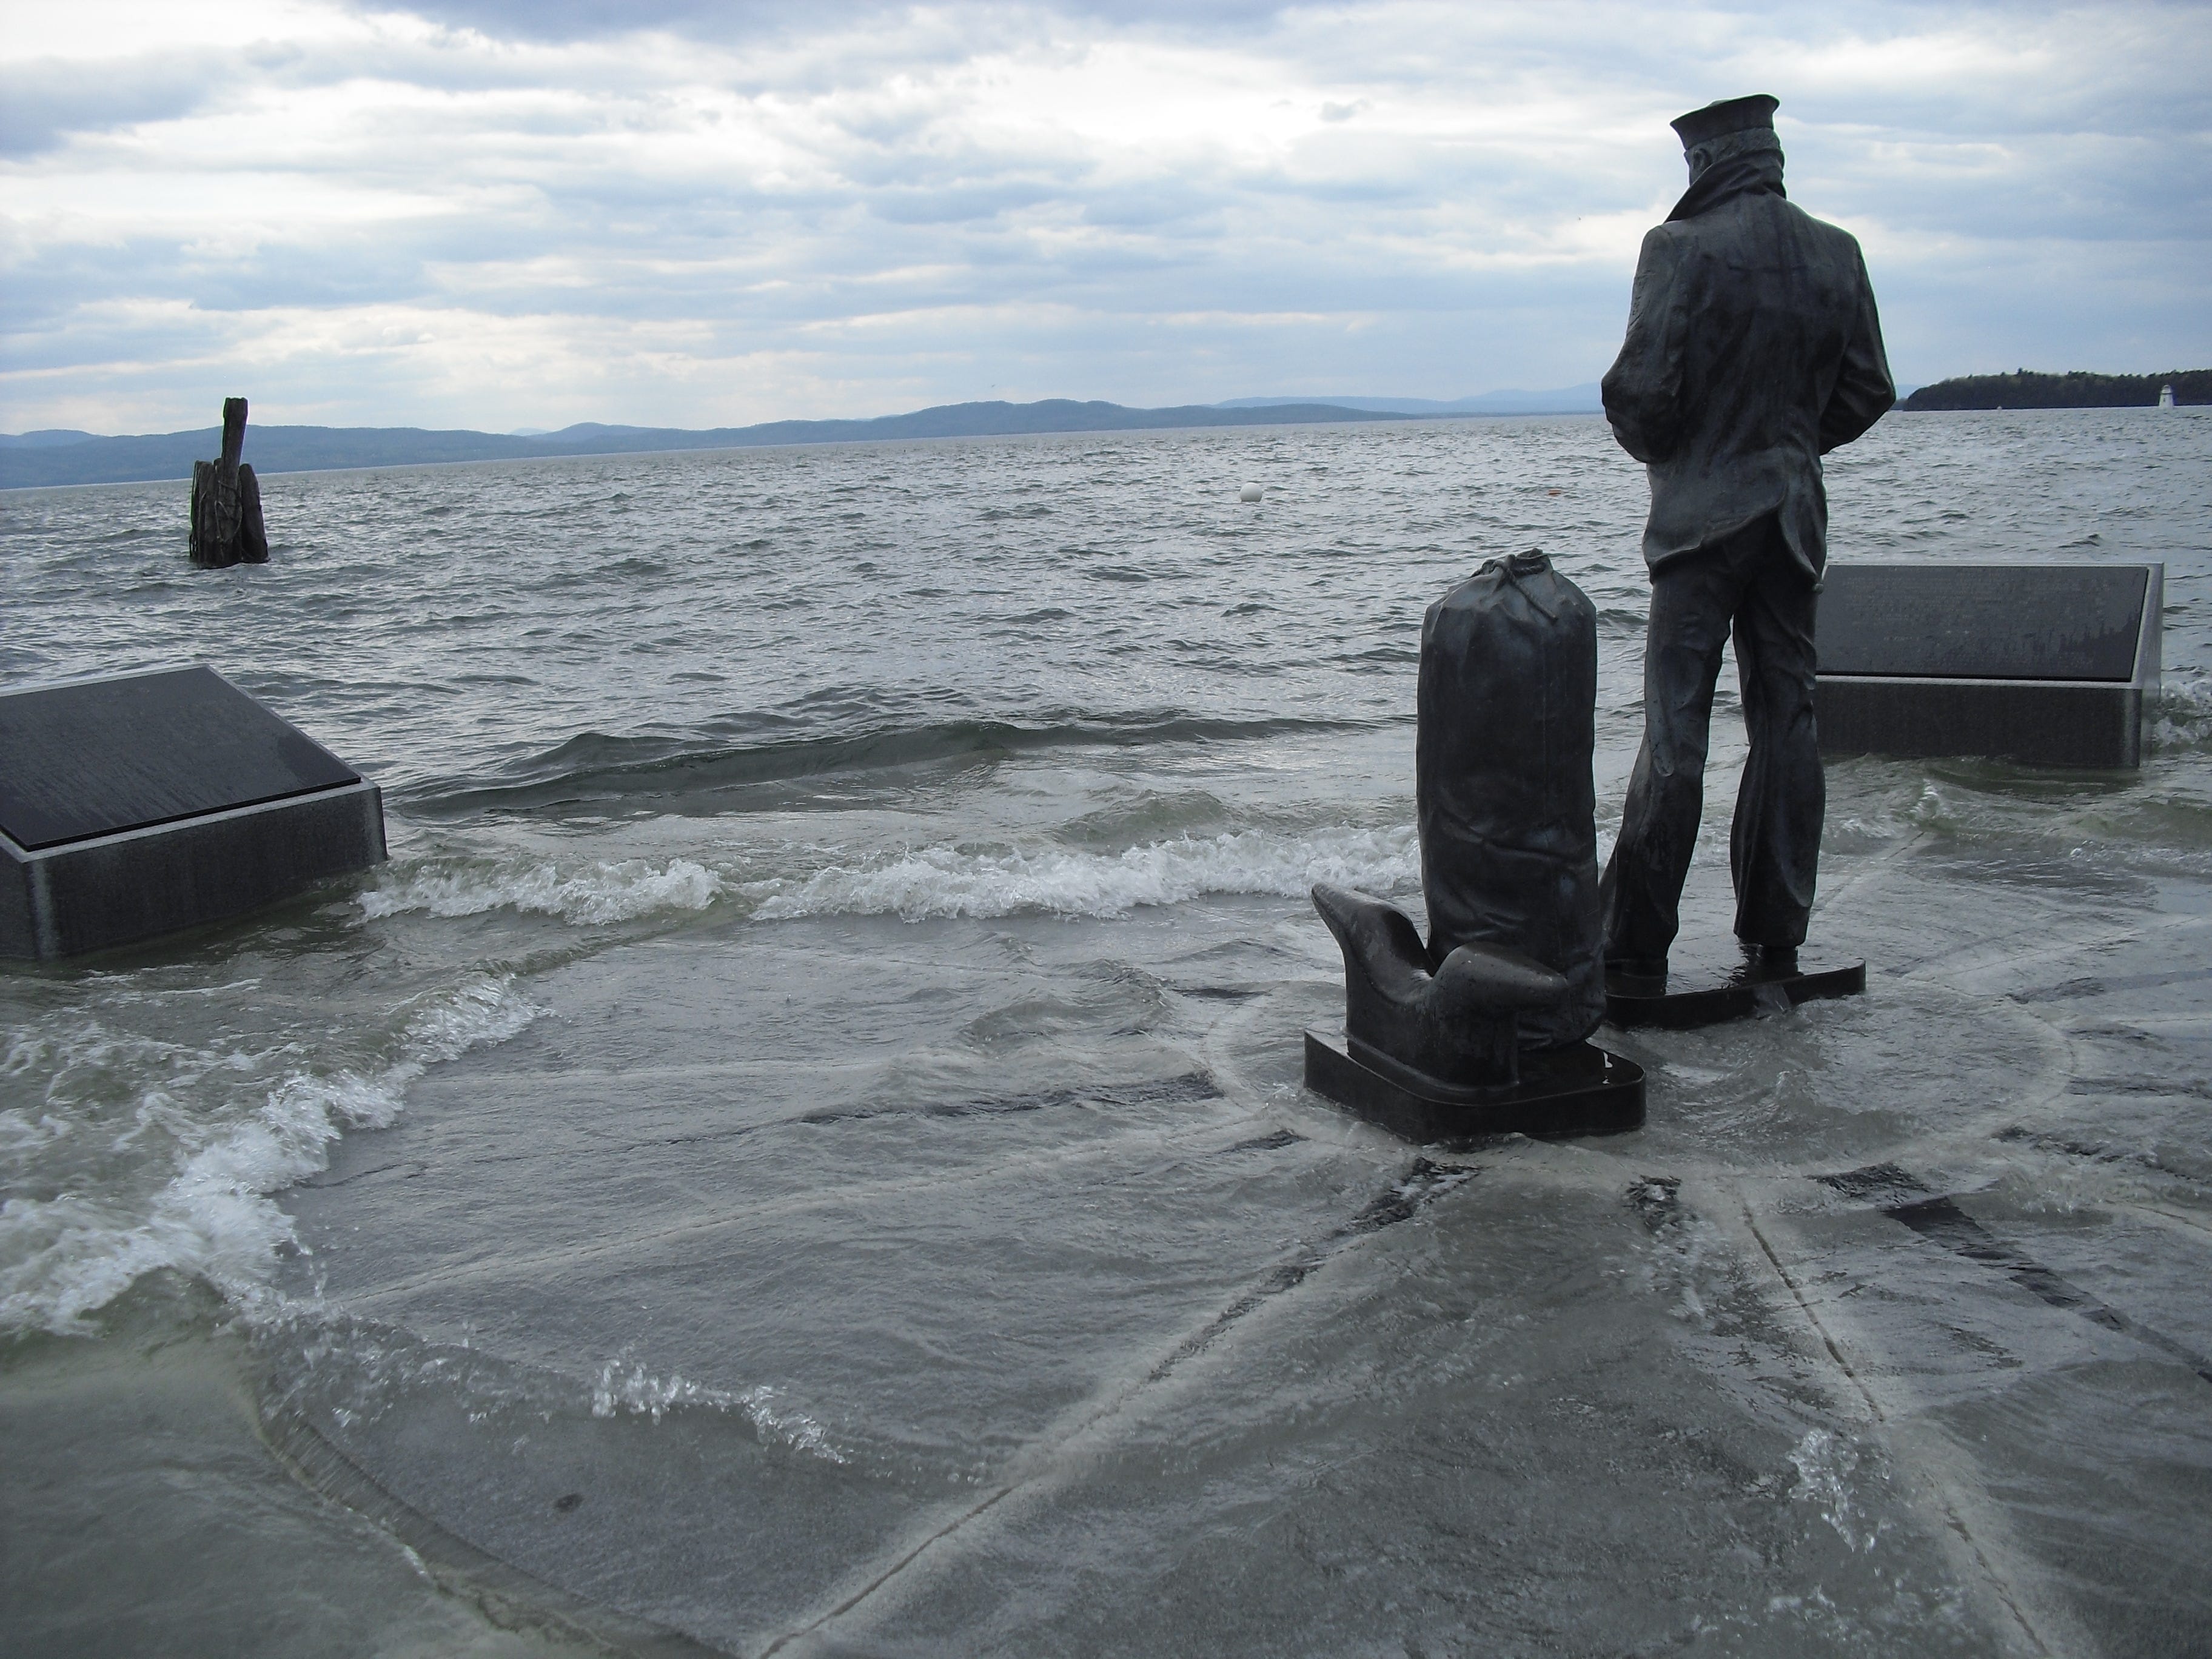
The Navy Memorial shoe-horned into Hoehl Park on the South Spit in 2005 includes the figure of a Lone Sailor as the centerpiece standing on a raised platform inlaid with the stylized points of a compass rose radiating out from underfoot, a replica of the first Lone Sailor bronze casting at the Navy Memorial on Pennsylvania Avenue in Washington, D.C. There are now 17 Lone Sailor statues standing by on other waterfronts also rich in naval history in the United States. One is located in Normandy, France; and one in Guam. Lone Sailor installations were not funded by the government.
As the USGS online data flawlessly represents the peaks and valleys of Lake Champlain water levels with every bump in variation continuously recorded through the years, and readily available for graphing and charting by individuals at home, we can see just how often the pendulum representing water level swings and can note the low and high extremes.
This year the lake level came close to the 1908 low. In 2011, spring runoff, snow melt and heavy rains that April contributed to a lake flood of biblical proportions. The lake reached an all-time official high of 103.57 feet above sea level on May 6, 2011, recorded at Whitehall, New York.
On that same day in Burlington, I took a photograph the Lone Sailor. As the movement of wind-driven waves washed over highlighted features of the inlaid compass rose the Lone Sailor seemed to be walking on water.